India’s NBFC landscape has been shifting quietly but decisively over the past year. The RBI’s tighter rules on unsecured lending, higher risk weights and closer scrutiny have forced a clear divide between lenders that run a tight ship and those that grew too fast. At the same time, banks have eased off in several retail and MSME pockets.
That has given well-run NBFCs room to regain share in home loans, vehicle finance, small business credit and co-lending. Borrowing conditions are also easing, with bond markets opening up again and funding costs beginning to settle.
For investors, this mix of pressure and relief creates an unusual moment. Liquidity is improving, and if it holds, funding for the better-managed NBFCs could get cheaper. A few of the mid-sized names that were ignored last year are already showing signs of revival — something that is visible in the way their share prices have moved recently. While over-optimism is unwarranted, the sector certainly merits a fresh look.
Mid-cap NBFCs, in particular, tend to feel the impact of policy shifts and liquidity swings faster than the larger players. When conditions worsen, they are the first to be tested. When conditions improve, they often recover earlier and sharper. Of course, not every mid-cap lender fits this pattern; only those with consistent underwriting, steady collections and sensible capital buffers are able to convert this phase into durable growth.
To keep the analysis simple and grounded, this article looks at mid-cap NBFCs except for housing finance companies using one straightforward filter: companies with a market value between Rs 5,000 crore and Rs 35,000 crore that have delivered the strongest three-year sales CAGR. It’s a clean, numbers-first approach that avoids guesswork and highlights lenders showing real business traction at a time when the sector is finally finding firmer footing.
#1 Capri Global: The 40% growth engine powered by gold
Capri Global Capital is a diversified non-banking financial company (NBFC) with a presence across diverse segments like MSME, affordable housing, construction finance segments, and car loan distribution; it forayed into Gold Loans in Aug 2022.
Capri Global reported a strong second quarter (2QFY26), supported by broad-based loan growth and a sharper operating profile. The company closed September with an AUM of Rs 27,040 crore, up 40% year-on-year (YoY), led by expansion in gold loans, housing, MSME lending and co-lending partnerships. Gold loans crossed Rs 10,000 crore for the first time, helped by deeper branch networks and faster digital processing. Housing and MSME portfolios also maintained steady momentum.
Profitability improved on the back of higher yields, better spreads and rising fee income from insurance and co-lending. Net interest income rose 57% while non-interest income nearly doubled. Cost-to-income ratios eased as more branches turned productive and technology investments began to show results.
Management said liquidity remains comfortable following recent capital infusion and an oversubscribed non-convertible debenture (NCD) issue. With borrowing costs expected to soften, the company reiterated its medium-term outlook of 30% annual AUM growth and a 4% Return on Assets (ROA) trajectory.
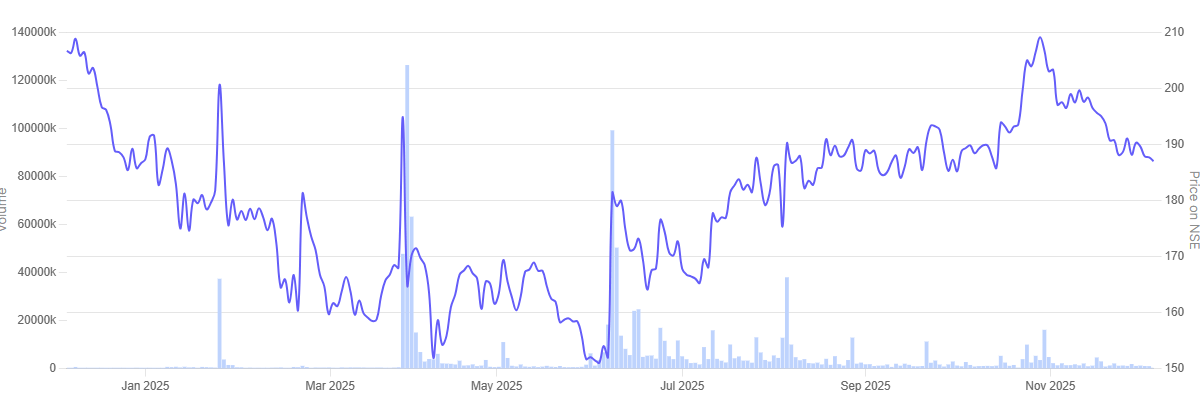
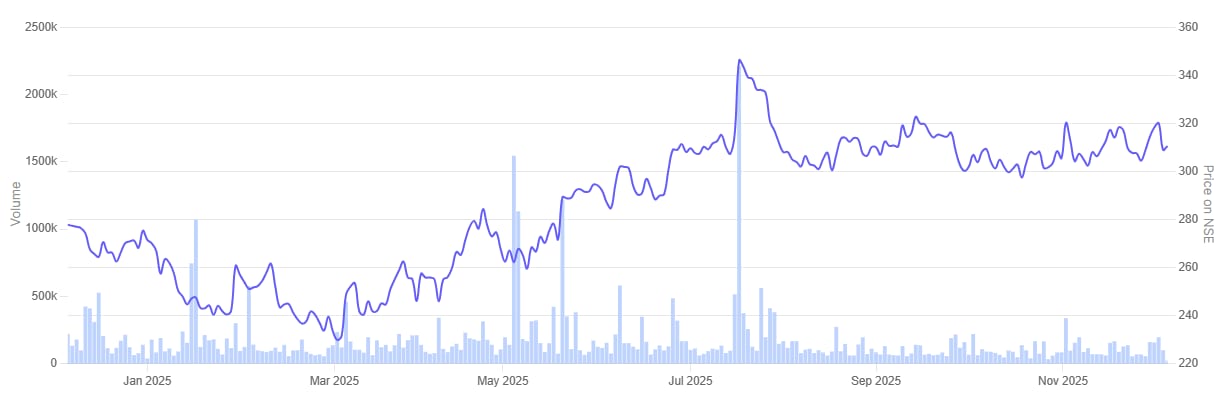
In the past one year Capri Global Capital share price is down 9.4%.
Capri Global Capital 1-Year Share Price Chart
#2 SBFC Finance: 29% growth with a ‘safety-first’ secured book
Incorporated in 2008, SBFC Finance is a systemically important, NBFC offering secured MSME loans and loans against gold.
SBFC Finance reported steady growth in the September quarter, supported by rising demand for secured MSME and property-backed loans. The company’s AUM stood at Rs 9,938 crore as of September, reflecting 29% YoY growth and 6% sequential expansion. MSME lending remains the core of the franchise, accounting for 82% of the loan book and growing at a similar pace. The lender added five new branches during the quarter, taking its network to 220 locations.
Yields improved to 18%, while the cost of borrowing fell to 9%, helping expand spreads to 9%. Operating costs continued to ease as more branches turned productive. Asset quality remained stable, with gross non-performing asset (GNPA) at 2.8%.
Management said borrowing costs are trending lower and should support margins going ahead. The company expects to maintain 5–7% quarterly growth, supported by better liquidity and a fully secured loan book.
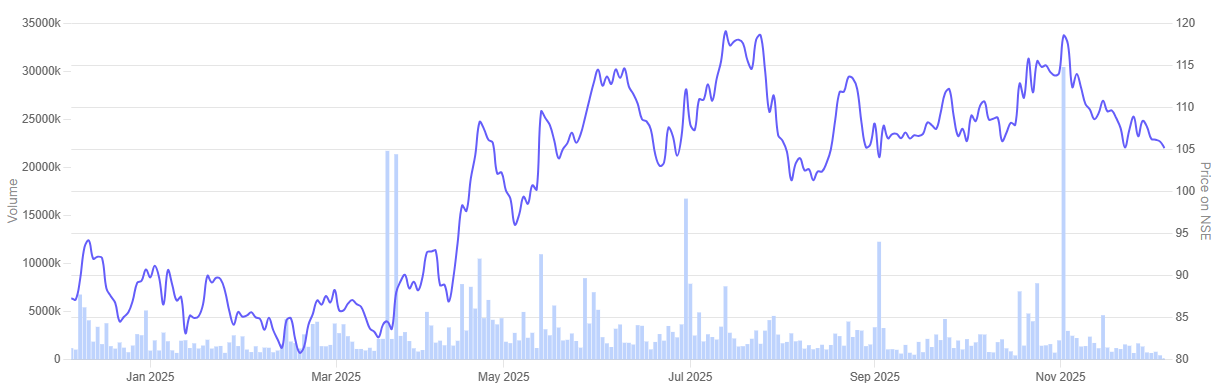
In the past one year SBFC Finance share price is up 20.5%.
SBFC Finance 1-Year Share Price Chart
#3 Fedbank Fina: Exiting risk to protect margins
Fedbank Financial Services a subsidiary of Federal Bank, provides gold loans, home loans, loan against property (LAP), and business loan services.
Fedbank Financial Services reported a steady second quarter as it continued reshaping its loan book toward fully secured assets. The company’s AUM stood at Rs 16,136 crore, rising 13.5% YoY, aided by strong momentum in gold loans and medium-ticket LAP. Gold AUM grew 36%, supported by 57 new gold loan branches and deeper doorstep coverage. Mortgage assets also expanded more than 22%.
Management remained focused on capital conservation and asset quality. The firm exited its unsecured MSME portfolio through assignments and an ARC sale, which helped release capital and reduce GNPA levels. Borrowing costs eased as the lender diversified its resource mix and secured US $ 150 million in external commercial borrowings (ECBs), improving spreads.
Operating costs reflected branch expansion, though cost-to-income showed early signs of moderation. The company expects collections to stabilise through FY26 as new teams and systems scale up. It reiterated that FY27 should reflect a more normalised cost structure and earnings trajectory.
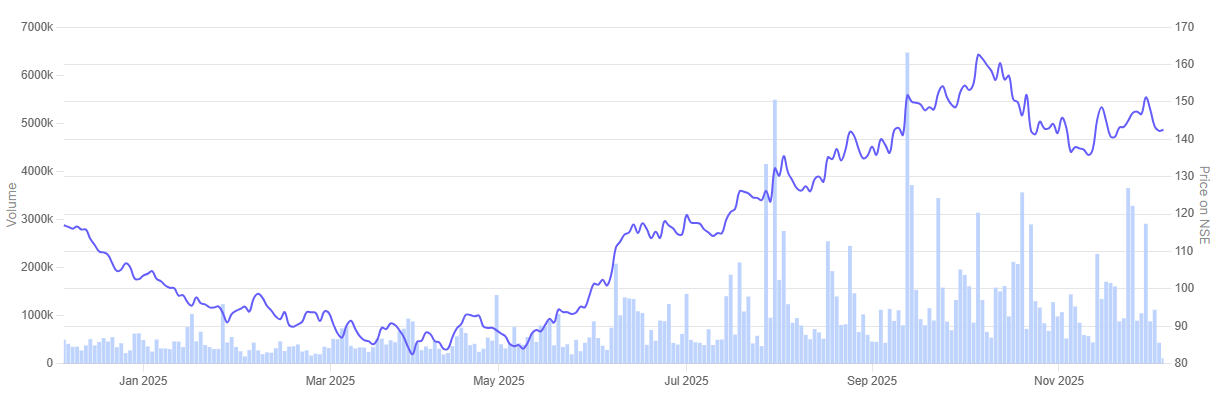
In the past one year Fedbank Financial Services share price is up 23.9%.
Fedbank Financial Services 1-Year Share Price Chart
#4 MAS Financial: A 25% income jump with stable asset quality
MAS Financial Services is a non-deposit taking NBFC registered with the RBI. The company lends mainly to small businesses and also finances home purchases, two-wheelers, used cars and commercial vehicles.
MAS Financial Services posted a steady second quarter, with most parts of the business recording healthy progress. Consolidated AUM touched Rs 13,821 crore at the end of September 2025, an 18.3% rise from a year earlier, while the standalone book stood at Rs 12,999 crore. Net profit on a consolidated basis increased to Rs 91.4 crore, helped by a strong 25% jump in total income.
MSME borrowers continue to form the bulk of the portfolio, accounting for roughly three-fourths of the assets. The rest comes from areas such as two-wheeler finance, commercial vehicle loans and salaried-customer offerings. Management said asset quality is stable, with gross Stage 3 assets at 2.5% and net Stage 3 at 1.7%. The company now reaches 15,000 pincodes and works with around 200 partner NBFCs, while keeping capital adequacy at 24.6% and a debt-to-equity ratio of 3.4 times.
Average borrowing cost declined to 9.6%, with incremental funding at 9.2%. Management reiterated its medium-term goal of 20–25% AUM growth and a long-term ambition of reaching Rs 1 lakh crore AUM over the next decade.
In the past one year MAS Financial Services share price is up 15.2%.
MAS Financial Services 1-Year Share Price Chart
Valuations
Let’s now turn to the valuations of the midcap NBFC companies in focus, using the Enterprise Value to EBITDA multiple as a yardstick.
Valuations of Midcap NBFC Stocks in India
| Sr No | Company | Price/Book Value | 10 Year Price/Book Value Median | ROE |
| 1 | Capri Global Capital | 2.7 | 5.2 | 11.8% |
| 2 | SBFC Finance | 3.4 | 3.4 | 11.6% |
| 3 | Fedbank Financial Services | 2.0 | 1.9 | 9.4% |
| 4 | MAS Financial Services | 2.1 | 3.2 | 14.1% |
On a price-to-book basis, the four NBFCs trade at levels that sit close to or below their long-term bands. Capri Global is valued at 2.7 times book, well under its ten-year median of 5.2. MAS Financial also quotes below its historical range at 2.1 times, compared with a decade median of 3.2.
SBFC Finance is the only one priced exactly in line with its ten-year average, while Fedbank Financial Services trades slightly above its long-term mark but still remains at the lower end of the group.
These gaps matter for a sector where book value and return profiles tend to guide long-term valuations.
The market appears to be waiting for clearer signs that easing liquidity and softer borrowing costs will translate into stronger earnings. The opportunity, if any, will lie with lenders that can demonstrate that improvement ahead of the broader pack.
Mid-sized NBFCs often re-rate only after several quarters of steady collections, better margins and visible control over credit costs. If the early signs of easing liquidity do translate into a firmer outlook, the companies with stronger balance sheets and tighter underwriting are likely to reflect that shift first.
Conclusion
The coming quarters will show whether this improvement in liquidity and sentiment can translate into a more durable upturn for mid-cap NBFCs. Each of the lenders discussed here has its own mix of strengths, risks and strategic choices, and their performance will depend as much on discipline as on the broader credit cycle. The sector has stepped into a more forgiving environment, but that alone does not settle the outlook.
For investors, this makes the space interesting but not straightforward. The growth numbers are strong, the portfolios are largely secured, and valuations sit close to long-term averages. Yet the real opportunity lies in identifying which of these companies can turn the easing cycle into sustained earnings without stretching their balance sheets. A careful reading of asset quality, funding access, and management behaviour is essential before taking any call.
In the end, mid-cap NBFCs may well benefit from this phase, but investment decisions should follow a comprehensive evaluation of fundamentals rather than the momentum of a single quarter.
Note: We have relied on data from www.Screener.in throughout this article. Only in cases where the data was not available, have we used an alternate, but widely used and accepted source of information.
The purpose of this article is only to share interesting charts, data points and thought-provoking opinions. It is NOT a recommendation. If you wish to consider an investment, you are strongly advised to consult your advisor. This article is strictly for educative purposes only.
Ekta Sonecha Desai has a passion for writing and a deep interest in the equity markets. Combined with an analytical approach, she likes to dig deep into the world of companies, studying their performance, and uncovering insights that bring value to her readers.
Disclosure: The writer and her dependents do not hold the stocks discussed in this article.
The website managers, its employee(s), and contributors/writers/authors of articles have or may have an outstanding buy or sell position or holding in the securities, options on securities or other related investments of issuers and/or companies discussed therein. The content of the articles and the interpretation of data are solely the personal views of the contributors/ writers/authors. Investors must make their own investment decisions based on their specific objectives, resources and only after consulting such independent advisors as may be necessary.
Leave a Reply