Price Movement and Volatility Analysis
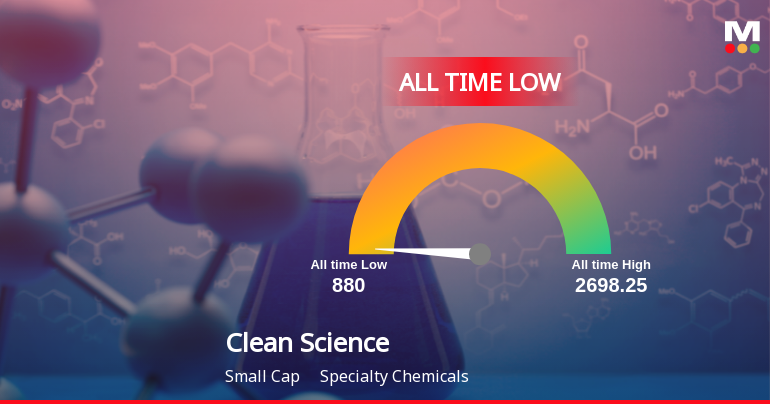
On 8 December 2025, Clean Science & Technology’s share price touched Rs.880.25, the lowest level recorded in its trading history. This decline is part of a five-day consecutive downward trend, during which the stock has shed approximately 3.37% in value. The trading range on the day was relatively narrow at Rs.7.45, yet the stock exhibited high intraday volatility, calculated at 41.39% based on the weighted average price. Such volatility indicates significant price fluctuations within the trading session despite the narrow range.
Comparatively, the stock’s one-day performance showed a fall of 0.65%, which was more pronounced than the Sensex’s decline of 0.18% on the same day. Over the past week, Clean Science & Technology’s price has moved down by 3.57%, while the Sensex recorded a marginal dip of 0.10%. The divergence becomes more evident over longer periods, with the stock posting a 5.83% decline over one month against a 2.81% gain in the Sensex.
Longer-Term Performance Trends
Examining the stock’s trajectory over the last three months reveals a substantial reduction of 25.63%, contrasting with the Sensex’s 5.91% gain. The one-year performance further highlights the disparity, with Clean Science & Technology registering a 31.75% decline while the Sensex rose by 4.71%. Year-to-date figures show an even steeper fall of 38.07% for the stock, whereas the Sensex advanced by 9.49%. Over a three-year horizon, the stock’s cumulative loss stands at 43.95%, in stark contrast to the Sensex’s 36.74% appreciation.
Notably, the stock has not recorded any gains over the five- and ten-year periods, remaining flat at zero percent, while the Sensex has delivered returns of 87.59% and 238.04% respectively over the same durations. This persistent underperformance against benchmark indices and sector peers underscores the challenges faced by Clean Science & Technology in maintaining shareholder value.
Financial Results and Profitability Metrics
Recent quarterly results for Clean Science & Technology indicate a contraction in profitability. The Profit Before Tax excluding other income (PBT less OI) stood at Rs.68.19 crores, reflecting a decline of 14.9% compared to the average of the previous four quarters. Similarly, the Profit After Tax (PAT) for the quarter was Rs.55.43 crores, down by 17.4% relative to the preceding four-quarter average. The Profit Before Depreciation, Interest and Taxes (PBDIT) reached Rs.87.09 crores, marking the lowest level recorded in recent quarters.
Despite these declines in absolute profit figures, the company’s Return on Equity (ROE) remains relatively high at 17.7%, signalling efficient utilisation of shareholder funds. However, this is accompanied by a Price to Book Value ratio of 6.3, suggesting a valuation that may be considered elevated when compared to historical averages of its peers.
Shareholder and Promoter Activity
Promoter shareholding in Clean Science & Technology has experienced a notable reduction, with a 24% decrease in promoter stake over the previous quarter. Currently, promoters hold 50.97% of the company’s equity. This reduction in promoter holding may be interpreted as a shift in confidence levels regarding the company’s near-term prospects.
Such changes in shareholding patterns often attract attention as they can reflect internal assessments of business outlook and strategic direction.
Sector and Market Context
Operating within the Specialty Chemicals industry, Clean Science & Technology faces a competitive environment where market dynamics and sectoral trends play a crucial role. The stock’s performance relative to the BSE500 index has been consistently below par over the last three years, with annual returns lagging behind the broader market benchmark in each period.
While the company maintains a low average Debt to Equity ratio of zero, indicating minimal leverage, the subdued growth in operating profit over the past five years, at an annual rate of 5.93%, points to restrained expansion in core business operations.
Technical Indicators and Moving Averages
From a technical perspective, Clean Science & Technology is trading below all key moving averages, including the 5-day, 20-day, 50-day, 100-day, and 200-day averages. This positioning typically reflects a bearish trend and may influence trading sentiment. The stock’s high intraday volatility further emphasises the unsettled nature of its price movements in recent sessions.
Summary of Key Financial and Market Metrics
To summarise, Clean Science & Technology’s stock price has reached an unprecedented low of Rs.880.25 amid a sustained period of negative returns and heightened volatility. The company’s recent quarterly profits have shown contraction, while its valuation metrics suggest a premium relative to historical peer averages. Promoter shareholding has declined notably, and the stock’s performance has lagged behind major market indices over multiple time frames.
Despite a strong Return on Equity and low leverage, the company’s subdued growth in operating profit and persistent underperformance against benchmarks highlight the challenges it currently faces within the Specialty Chemicals sector.
Limited Time Only! Upgrade now and get 1 Year of Stock of the week worth Rs. 14,999 for FREE. Don’t miss out on this exclusive offer. Claim Your Free Year →
Leave a Reply