Technical Momentum and Price Movement
The stock of Bajaj Finance closed at ₹1,048.45, marking a day change of 1.89% from the previous close of ₹1,029.05. The intraday trading range spanned from ₹1,027.85 to ₹1,061.00, with the 52-week high at ₹1,102.45 and a low of ₹666.80. This price action suggests a consolidation phase near the upper end of its annual range, indicating sustained investor interest.
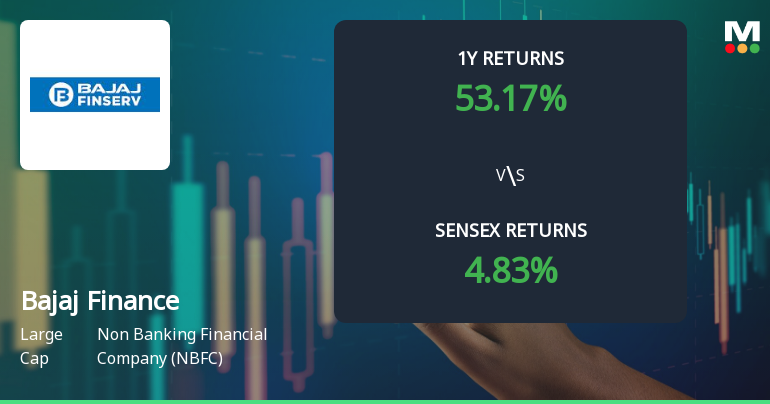
Over the past week, Bajaj Finance recorded a return of 1.04%, outperforming the Sensex’s marginal 0.01% gain. However, the monthly return showed a decline of 0.80%, contrasting with the Sensex’s 2.70% rise. Year-to-date and one-year returns stand at 53.51% and 53.17% respectively, significantly surpassing the Sensex’s 9.69% and 4.83% for the same periods. Longer-term performance over three, five, and ten years further emphasises the stock’s robust growth trajectory relative to the benchmark index.
Moving Averages and Trend Analysis
Daily moving averages for Bajaj Finance currently indicate a bullish trend, signalling that short-term price momentum is aligned with upward movement. This is consistent with the broader technical trend, which has shifted from mildly bullish to bullish. The alignment of moving averages often serves as a foundational indicator for traders assessing trend strength and potential continuation.
On a weekly basis, the Dow Theory reflects a mildly bullish stance, though the monthly perspective shows no definitive trend. This divergence between timeframes suggests that while short- to medium-term momentum is positive, longer-term directional clarity remains to be fully established.
MACD and Momentum Indicators
The Moving Average Convergence Divergence (MACD) indicator presents a mixed picture. On a weekly scale, the MACD is mildly bearish, suggesting some short-term momentum caution. Conversely, the monthly MACD remains bullish, indicating that longer-term momentum retains strength. This divergence may reflect recent consolidation or profit-taking phases within an overall upward trend.
The Relative Strength Index (RSI) does not currently signal overbought or oversold conditions on either weekly or monthly charts, implying a neutral momentum stance. This absence of extreme RSI readings suggests that the stock is not presently stretched in either direction, allowing room for potential directional moves based on forthcoming market catalysts.
Bollinger Bands and Volatility
Bollinger Bands on both weekly and monthly timeframes indicate bullish conditions. The stock price trading near the upper band often reflects strong buying interest and potential continuation of upward momentum. This technical parameter also hints at moderate volatility, which investors may interpret as a sign of healthy price discovery rather than erratic swings.
Volume and On-Balance Volume (OBV)
On-Balance Volume (OBV) analysis shows a mildly bearish signal on the weekly chart, while the monthly OBV remains without a clear trend. This suggests that volume patterns have not decisively confirmed the price moves in the short term, highlighting the importance of monitoring volume alongside price action for a comprehensive view of market sentiment.
KST Indicator and Market Sentiment
The Know Sure Thing (KST) indicator is bullish on both weekly and monthly charts, reinforcing the notion of positive momentum across multiple time horizons. This indicator’s alignment with other bullish signals supports the view that Bajaj Finance is positioned favourably within its sector, despite some mixed signals from other technical parameters.
Sector and Market Context
Bajaj Finance operates within the Non Banking Financial Company (NBFC) sector, a segment that has experienced varied market conditions in recent years. The stock’s performance relative to the Sensex, particularly its substantial outperformance over one, three, five, and ten-year periods, underscores its resilience and growth potential amid sectoral challenges.
While the Sensex has recorded returns of 4.83% over one year and 36.41% over three years, Bajaj Finance’s returns of 53.17% and 57.40% respectively highlight its capacity to generate shareholder value beyond broader market movements. This relative strength is an important consideration for investors analysing sectoral leadership and stock-specific momentum.
Implications for Investors
The recent revision in the company’s evaluation metrics, particularly the shift from mildly bullish to bullish technical trend, suggests an evolving market assessment of Bajaj Finance’s price momentum. The interplay of mixed signals from MACD and OBV alongside bullish moving averages and KST indicators points to a nuanced technical landscape.
Investors may find value in monitoring the stock’s behaviour around key moving averages and Bollinger Bands, as these often act as dynamic support and resistance levels. The neutral RSI readings further imply that the stock is not currently in an extreme condition, allowing for potential directional moves based on upcoming market developments or sectoral shifts.
Given Bajaj Finance’s strong historical returns relative to the Sensex, the stock remains a significant player within the NBFC sector. However, the presence of some short-term bearish signals warrants a balanced approach, combining technical analysis with fundamental insights to navigate potential volatility.
Conclusion
Bajaj Finance’s technical parameters reveal a complex but generally positive momentum profile. The bullish daily moving averages, supportive Bollinger Bands, and favourable KST indicators contrast with some cautionary weekly MACD and OBV signals. This blend of signals reflects a market in transition, with the stock positioned near its 52-week highs and demonstrating resilience against broader market fluctuations.
As the NBFC sector continues to evolve, Bajaj Finance’s price action and technical indicators will remain key factors for investors seeking to understand its market positioning. The recent changes in analytical perspective underscore the importance of a comprehensive approach to technical analysis, integrating multiple indicators and timeframes to form a well-rounded view.
Get 1 year of Weekly Picks FREE when you subscribe to MojoOne. Offer ends soon. Start Saving Now →
Leave a Reply